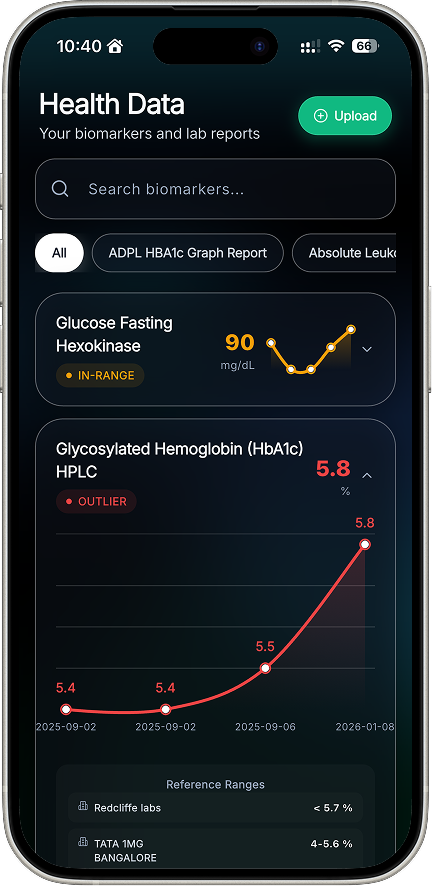
Upload a blood report from any lab, anywhere in the world. Nostavia parses native PDFs, decodes 100+ biomarkers, and classifies each as Optimal, In-range, or Outlier — with historical trend lines that catch deterioration before it becomes a problem. All delivered under your partner brand.
| Test | Results | Ref Range |
| WBC | 5.4 x10⁹/L | 4.0-10.0 |
| RBC | 4.2 x10¹²/L | 4.5-5.9 |
| Hemoglobin | 13.0 g/dL | 13.5-17.5 |
| Hematocrit | 39.0 % | 40.0-54.0 |
| Platelets | 250 x10⁹/L | 150-400 |
Accept blood reports from any lab worldwide. Our ingestion architecture handles native PDFs, digital signatures, and varied formats — validated across 282 clinical test cases.
Go beyond "normal." Every biomarker is classified as Optimal, In-range, or Outlier for long-term health — not just clinical reference ranges.
Every biomarker carries a trend line across tests. Deterioration becomes visible months before it triggers a clinical flag, enabling early intervention.
Built on SOC 2 Type II certified infrastructure with GDPR and DPDP compliance. All data encrypted in transit and at rest.
Nostavia's Lab Intelligence parses any blood report PDF, decodes 100+ biomarkers with optimal-range scoring, tracks historical trends, and flags biomarker drift automatically — all delivered under your partner brand.
Yes. Our ingestion architecture has been stress-tested against real-world clinical reports from labs worldwide, including validation across 282 clinical test cases with a leading Indian diagnostics chain.
Standard parsers extract data. Nostavia interprets it. We classify biomarkers against optimal ranges for long-term health, build historical trend lines, flag deterioration early, and generate actionable protocols — not just structured data.
By turning a one-time lab report into a continuous engagement engine. Users track their biomarkers over time, receive drift alerts, and get data-triggered prompts for their next test — keeping them inside your product between visits.